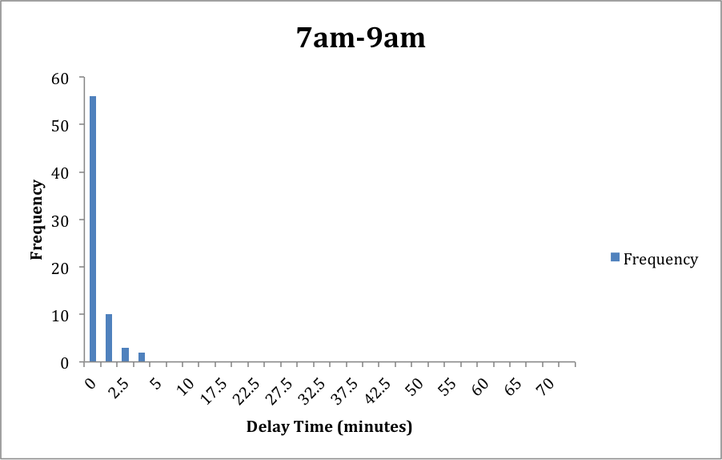
Flight delay in our program can be broken down into two parts: random delay and delay resulting from scheduling inefficiencies. The total delay for every single flight is the sum of these two components. Random delay will occur no matter how the airport traffic controllers determine scheduling a flight. It is a result of unpredictable occurrences like plane malfunctions, weather, flight crew cancellations, etc. Every plane at the gate has a determined random delay according to a historical distribution. We determined this distribution to be exponential after analyzing the historical flight data on October 1st, 2013. We looked at 4 time intervals, 7:00 am to 9:00 am, 10:00 am to 12:00 pm, 2:00 pm to 4:00 pm, and 5:00 pm to 7:00 pm, and plotted histograms. The histogram for the 7:00 am to 9:00 am time interval is shown below. The other three follow a similar pattern.
There are approximately 56 instances of flight delay from 0 to 2.5 minutes in the 7:00 am to 9:00 am interval. The histograms illustrate a high frequency of delays in the 0 to 10 minute range. The amount of delays at higher times then appears to level off exponentially. Therefore, we decided to give an exponential distribution to each flight’s random delay. In our model, we set the mean of the distribution to be 5 minutes, the approximate average delay time for a flight at Lambert on October 1st, 2013.
There are approximately 56 instances of flight delay from 0 to 2.5 minutes in the 7:00 am to 9:00 am interval. The histograms illustrate a high frequency of delays in the 0 to 10 minute range. The amount of delays at higher times then appears to level off exponentially. Therefore, we decided to give an exponential distribution to each flight’s random delay. In our model, we set the mean of the distribution to be 5 minutes, the approximate average delay time for a flight at Lambert on October 1st, 2013.
